Telemetries Data
Timeseries APIs
Timeseries APIs are mainly used when you want to obtain, for a certain type of data, a detailed trend, which allows you to perform real-time analysis and representations, for a customized time window.
These type of APIs are always structured as follows:

The path, which allows you to point to the desired resources, always requires the following parameters:
{power,frequency,wind,temperature,voltage,current,energy,kpis}: the type of resource to point to. This parameter does not specify the actual data you want to obtain, but the general category to which the desired data belongs (please note that an API call only accepts one category at a time, it is not currently possible to make BULK calls);{entityID}: it can be a plant or a device EID. In the first case, the value obtained takes into account the aggregation of all the devices, for which that value exists, at the plant level; in the second case, the value obtained referred to the single device of interest;{dataType}: represents the actual data to be obtained. The availabledataTypesvary according to the resources pointed at, a detailed description is available directly in the OpenAPIs Swagger;{valuetype}: represents the type of aggregation criterion with which the requested data is to be obtained.
The queries, that allow you to filter the requested data, always require the following parameters:
{sampleSize}: defines the sampling rate with which to obtain data. The longer the sampling rate, the shorter the length of the data array obtained in response (asampleTimeequal toMin5will have more samples in the response array than asampleTimeequal toMin15);{startDate}: the lower-bound that allows to define the beginning of the time window of interest. Its format is alwaysYYYYMMGG(eg: 20220321);{endDate}: the upper-bound which allows to define the end of the time window of interest. Its format is alwaysYYYYMMGG(eg: 20220322) and it must be temporally subsequent to the{startDate};{timezone}: allows to guide the API call to a correct data recovery according to the requested time zone. The choice of timeZone affects the epochs returned within the response array.
A timeseries call usually provides an array of values as response.
The length of the array directly depends on the {sampleSize} value and on the time window defined by the {startDate} and {endDate} parameters. Once a reference time window has been defined, the {sampleSize} value will slice that window more or less frequently thus consequently modifying the length of the array in response: the greater the {sampleSize} value, the sparsely the time window will be sliced therefore resulting in less elements in the response array.
It is worth looking at a direct example to better explain these concepts.
Example
Let’s suppose we want to represent the real-time trend of the power produced by an inverter, during the current day (suppose we are in the spring equinox). The best solution is to use a Timeseries API, which will have the following general structure:
https://api.auroravision.net/api/rest/v1/stats/{power,frequency,wind,temperature,voltage,current,energy,kpis}/timeseries/12345678/{dataType}/{valueType}?{sampleSize}&{startDate}&{endDate}&{timeZone}
Within the generic structure above we know that:
- The category of resources to aim for is
{power}and, within this category, the{dataType}to call is theGenerationPower; - The
{valueType}Maximum,MinimumandAverage(please refer to detailed analysis further down below); - The time window is the day of the spring equinox, therefore
{startDate}will be 20220321 and{endDate}will be 20220322;
This leads our call to take the following form:
https://api.auroravision.net/api/rest/v1/stats/power/timeseries/12345678/GenerationPower/average?{sampleSize}&startDate=20220321&endDate=20220322&{timeZone}
The {sampleSize} parameter can have the following values:
Min5: the time window is sliced every 5 minutes, taking every single sample saved on Aurora Vision (see Page 1);Min15: the time window is sliced every 15 minutes, 3 Aurora Vision samples are included for each slice;Min30: the time window is sliced every 30 minutes, 6 Aurora Vision samples are included for each slice;Hour: the time window is sliced every 60 minutes, 12 Aurora Vision samples are included for each slice;Day: the time window is sliced every day, 288 Aurora Vision samples are included for each slice;Month: the time window is sliced every month;Year: the time window is sliced every year.
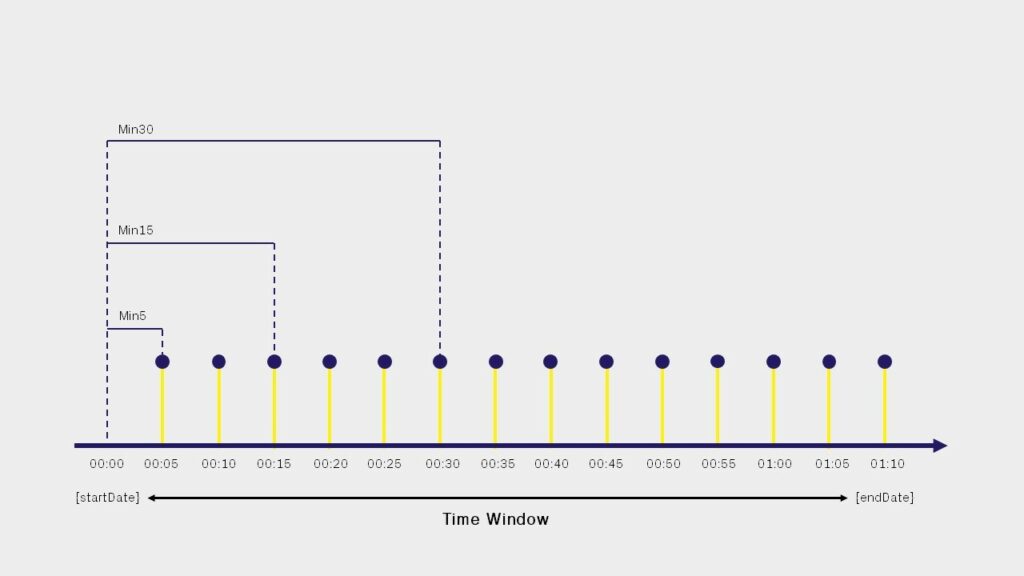
Since we are interested in representing the power trend in real-time, as frequently as possible, we choose to set the {sampleSize} to Min5 (it would not make sense to enter a value greater than that of the chosen time window) and set the {timeZone} parameter to Europe/Rome:
https://api.auroravision.net/api/rest/v1/stats/power/timeseries/12345678/GenerationPower/average?sampleSize=Min5&startDate=20220321&endDate=20220322&timeZone=Europe/Rome
The response will be an array of a certain lenght in which each element will always be composed by the following structure:

As we can see, the response is made up of:
Start: represents the epoch, which is the time value in UTC; changes according to thetimeZone(different time zones will have different epochs for the same power value) and follows the temporal slices defined by thesampleSize;Units: represents the unit of measurement;Value: represents the value.
Let’s extrapolate a larger extract from the response:
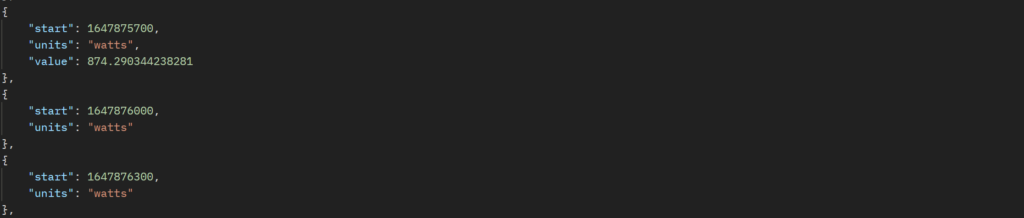
The start field increases from element to element, passing from a value of 1647875700 to a value of 1647876000; if we make the difference between the two epochs, what we get is exactly 5 minutes or, in other words, the value we have set for the sampleSize parameter.
From epoch 1647876000 the fields start and value no longer exist; this is because, assuming that the call has been made before 16:20 (Europe/Rome), the sample referred to with that epoch is in the future and, therefore, not yet existing. As such, Aurora Vision does not provide the field within the element; however, on a new call made after 16:20, it will provide it because it has been populated.
The principle on the presence/absence of certain fields in the response elements of a timeseries API (expressed in the last lines of the example above) is of fundamental importance: it does not apply only in the case of future samples, but also and above all in the case of complete absence of data on Aurora Vision. This allows to provide coherence to the responses obtained from the telemetries APIs, because when the value field is present, it means that that value actually exists on Aurora Vision otherwise it would not be present.
As was the case for aggregated calls, also for timeseries calls the {valuetype} parameter is of great importance because it varies according to the category of resources, therefore of {dataType}, to be obtained and is also affected by the {sampleSize}.
For a {dataType} belonging to the category {power,frequency,wind,temperature,voltage,current,kpis}, the {valueType} can assume three different values:
Maximum: returns the maximum value found among all the samples inside every time slice, determined by the{sampleSize}value, in the defined{startDate}and{endDate}time window, for the requested{dataType};Minimum: returns the minimum value found among all the samples inside every time slice, determined by the{sampleSize}value, in the defined{startDate}and{endDate}time window, for the requested{dataType};Average: returns the average value of all the samples inside every time slice, determined by the{sampleSize}value, in the defined{startDate}and{endDate}time window, for the requested{dataType};
NOTE: for the kpis category, the above considerations are valid only if Power-Based KPIs are called. For more details, please refer to OpenAPIs Swagger.
Let’s take a look at some use cases, where we consider a plant ( entityID: 12345678 ) with a single registered inverter device ( entityID : 87654321 ):
Use Case 1
I want to get the power generated by the inverter in real-time, every 5 minutes, on the day of the spring equinox. In this way I can plot the trend and perform specific analysis on it.
Problem Analysis
Considering that the ratio between plant and registered devices is 1:1, I can indifferently enter the entityID of one of the two. I want the power produced, so I will point the resources of the power category and request the GenerationPower. The sampleSize parameter will be equal to Min5 , because I want to get every single sample. The valueType parameter can be, only in this case, set indifferently as Maximum, Minimum or Average because the time window is sliced in such a way as to have a single sample for each slice and, therefore, no actual operation makes the difference if there is a single sample as reference.
Request
GET https://api.auroravision.net/api/rest/v1/stats/power/timeseries/12345678/GenerationPower/average?sampleSize=Min5&startDate=20220321&endDate=20220322&timeZone=Europe/Rome
Charted Response
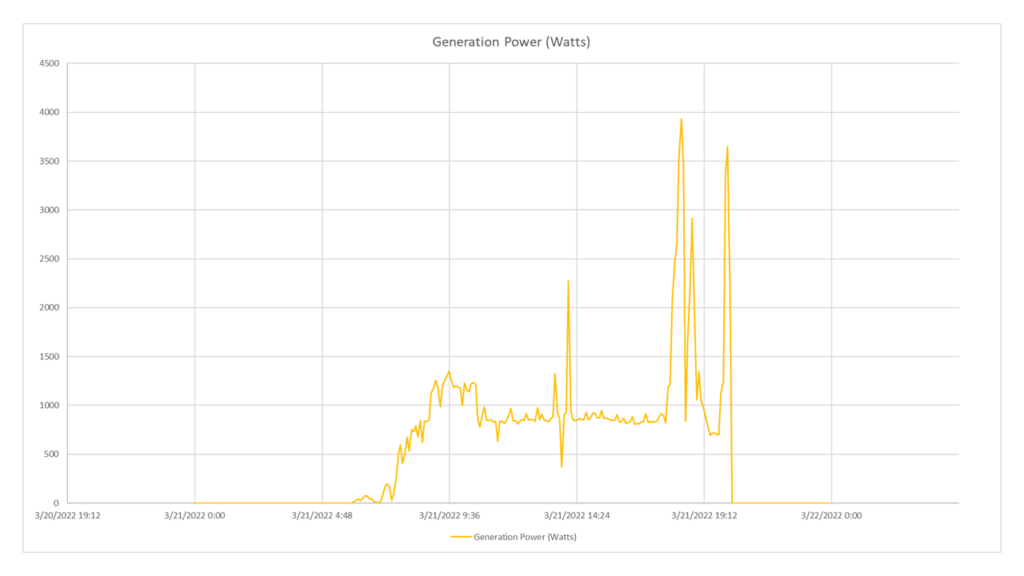
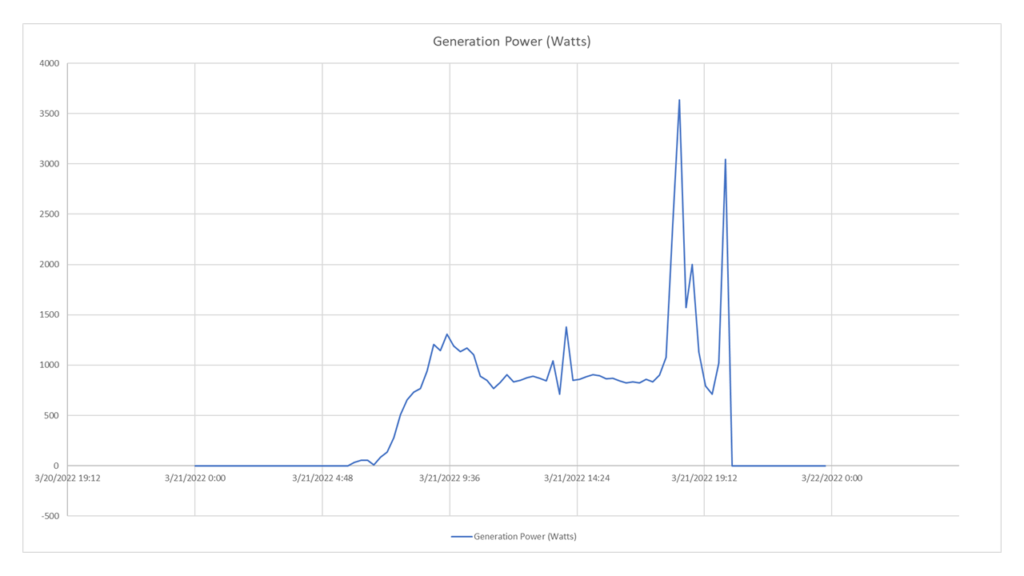
Use Case 2
I want to get the average power generated by the inverter every 15 minutes, on the day of the spring equinox. In this way I can plot the trend and perform specific analysis on it.
Problem Analysis
Considering that the ratio between plant and registered devices is 1:1, I can indifferently enter the entityID of one of the two. I want the power produced, so I will point the resources of the power category and request the GenerationPower. In this case the sampleSize parameter will be equal to Min15. The valueType parameter must be Average because the time window is sliced in such a way as to have 3 samples for each slice and, therefore, the average is performed on the 3 samples belonging to each slice.
Request
GET https://api.auroravision.net/api/rest/v1/stats/power/timeseries/12345678/GenerationPower/average?sampleSize=Min15&startDate=20220321&endDate=20220322&timeZone=Europe/Rome
Charted Response
For a {dataType} belonging to the category {energy,kpis}, the {valueType} can assume two different values:
Cumulative: returns the last cumulative value available inside every time slice, determined by the{sampleSize}value, in the defined{startDate}and{endDate}time window, for the requested{dataType};Delta: returns the difference between the last and the first cumulative value available inside every time slice, determined by the{sampleSize}value, in the defined{startDate}and{endDate}time window, for the requested{dataType};
NOTE: for the kpis category, the above considerations are valid only if Energy-Based KPIs are called. For more details, please refer to OpenAPIs Swagger.
Let’s take a look at some use cases, where we consider a plant ( entityID: 12345678 ) with a single registered inverter device ( entityID : 87654321 ):
Use Case 1
I want to get the energy generated by the inverter in real-time, every 5 minutes, on the day of the spring equinox; in order to plot the energy trend.
Problem Analysis
Considering that the ratio between plant and registered devices is 1:1, I can indifferently enter the entityID of one of the two. I want the energy produced, so I will point the resources of the energy category and request the GenerationEnergy. The sampleSize parameter will be equal to Min5 , because I want to get every single sample. The valueType parameter will be equal to delta because the time window is sliced in such a way as to have a single sample for each slice and, therefore, the difference between the samples will provide the energy actually produced in the 5 minutes.
Request
GET https://api.auroravision.net/api/rest/v1/stats/energy/timeseries/12345678/GenerationEnergy/delta?sampleSize=Min5&startDate=20220321&endDate=20220322&timeZone=Europe/Rome
Response

Use Case 2
I want to get the energy generated by the inverter for every day of the week of the spring equinox, in order to plot the weekly energy trend.
Problem Analysis
Considering that the ratio between plant and registered devices is 1:1, I can indifferently enter the entityID of one of the two. I want the energy generated every single day of the week of the spring equinox, so I will point the resources of the energy category and request the GenerationEnergy. The sampleSize parameter will be equal to Day, because I want to slice the time window every single day of the week. The valueType parameter will be equal to delta because the time window is sliced in such a way as to have the difference between the first and last sample of each day of the week (time window).
Request
GET https://api.auroravision.net/api/rest/v1/stats/energy/timeseries/87654321/GenerationEnergy/delta?sampleSize=Day?startDate=20220321&endDate=20220327&timeZone=Europe/Rome
Response
