Plant Summary
Having the main plant information available is always essential, because it allows to obtain an immediate and overall view of the relevant parameters before eventually going into the details of the analysis. The Plant Summary section is designed precisely for this purpose: have information on location, status, energy production and weather forecasts available in a simple and intuitive way.
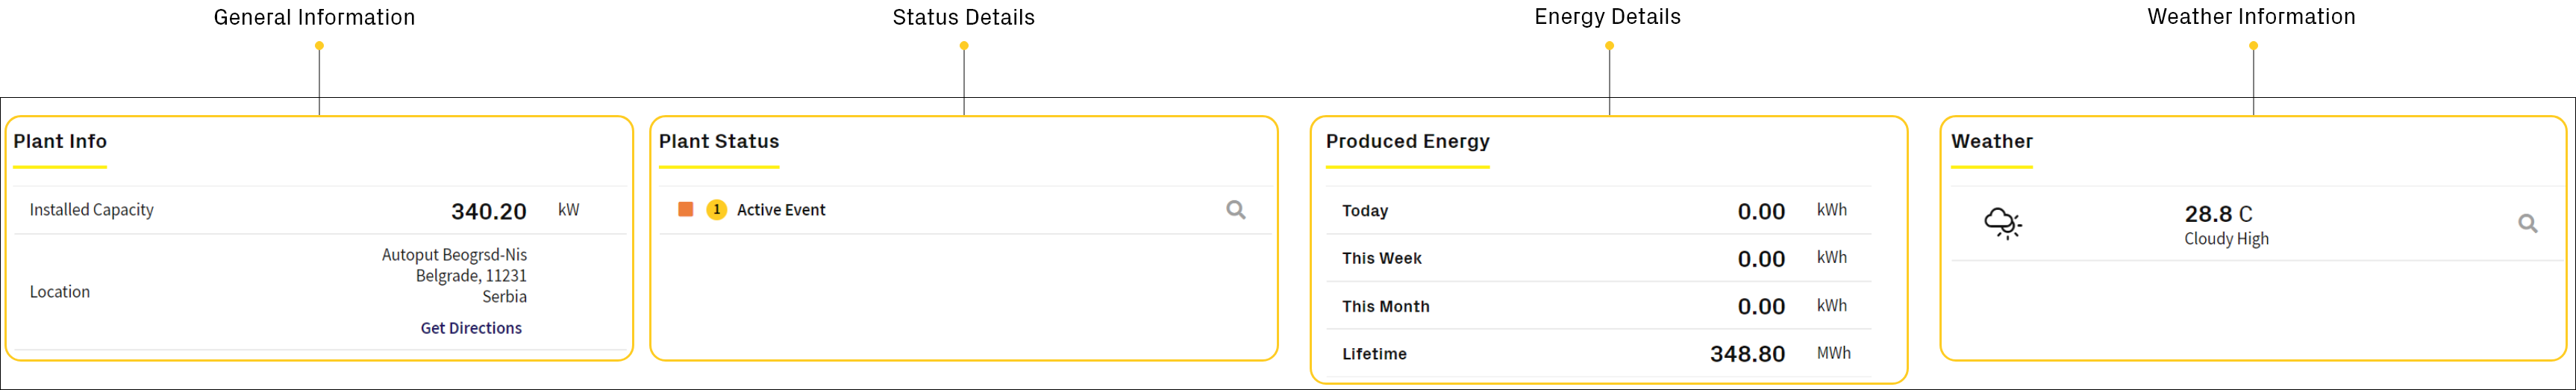
General Information
Starting from the left you can find Plant Info column which shows the main information of the plant that has been selected.
In particular, it shows the Installed Capacity, entered in input during the creation of the plant, in [kW] and also the information on the Location. Moving the cursor on Get Directions it is possible to open Google Maps by releasing a pin on the exact position of the plant; this feature is handy if you want to understand how long it may take to reach a plant, in the event of an intervention in the field, or to share the exact position of the plant with your installers.
Status Details
The Status Details column shows if there are any active error events (at the time of the last refresh of the page).
As we have seen in the List View on the Home page, also in this case an “at-a-glance” view is provided which indicates the number of active error events with an icon that will correspond to the event with the highest severity identified. In case there is no active events, there will be no possibility to explode any details; but if there is at least one active error event, it will be possible to click on the magnifying glass icon to open a pop-up window which will provide a complete list of events.
For each event it will be indicated:
- The asset linked to the event;
- The time and date of activation;
- The description and type.
Energy Details
The Energy Details column shows the solar AC generation energy, in [kWh], for different time windows.
The time windows involved are:
- Today: energy generated today;
- This Week: energy generated in the current week (considering the week as from Sunday to Sunday);
- This Month: energy generated in the current calendar month;
- This Year: energy generated in the current calendar year.
This information is particularly useful because it allows to have an immediate estimate of the performance of the plant, in particular for the current observation day. In fact, if, for example, the energy generated today is lower than normal, it would certainly be worthwhile to carry out a more in-depth analysis on what the causes may be and if the latter impact one or more inverters.
Weather Information
The Weather Information column shows the weather forecasts, updated in real time based on the page update, for the current day. These forecasts are provided by a weather service that takes into consideration the location of the plant to estimate a forecast as accurate as possible.
If there are compatible sensors installed and detected on the plant, it will be possible to click on the lens-shaped icon to expand a pop-up window and view in detail all the information read by the sensors in time real.