Chapter 3 – Plant Dashboard
The Dashboard page allows you to perform complex multi-level stratified analyzes, on the selected plant, by making information and telemetry available to the user at the plant or device level, thus exploding as much detail that is deemed appropriate.
In this way, users with different experience and knowledge can conduct analyzes appropriate to their needs: whether we are talking about an overview of the plant performance or about the identification of under-performing conditions at the level of a single device.
In this chapter you will see:
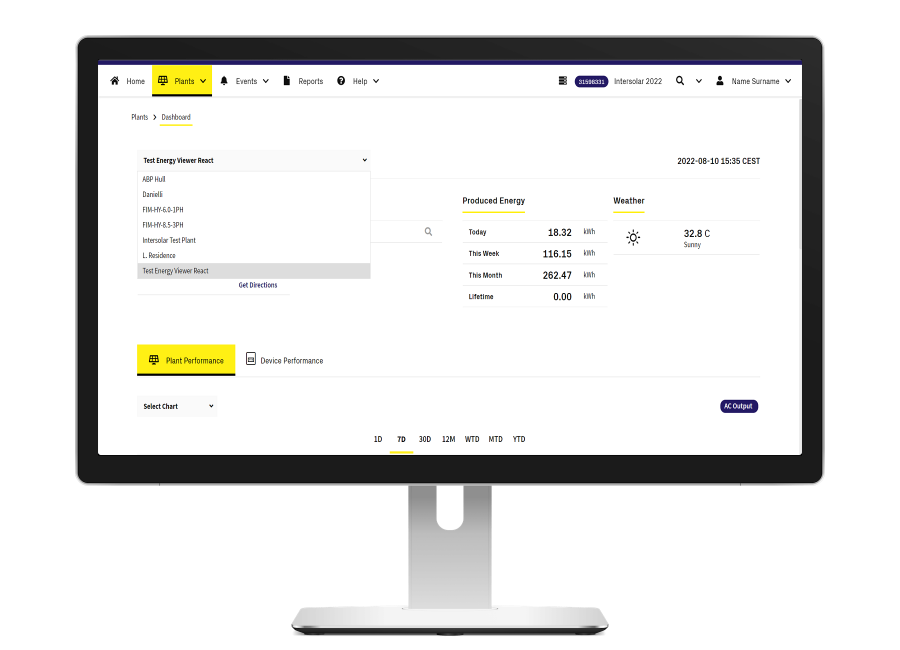
Click on the image to learn how to select a plant in order to access the Dashboard page and start analyzing telemetries.
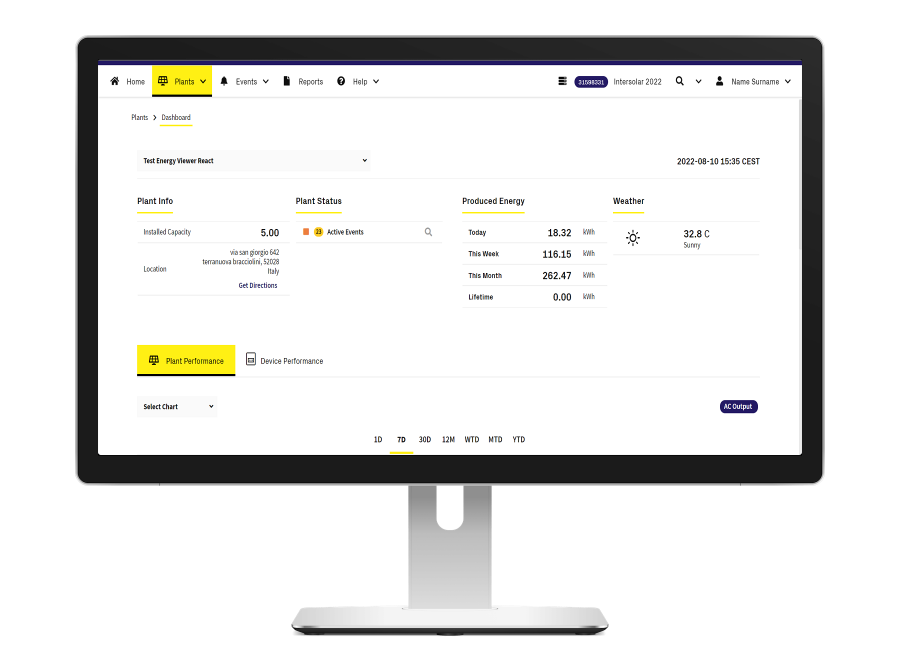
Click on the image to learn how to move in the plant information section and take advantage of the main features.
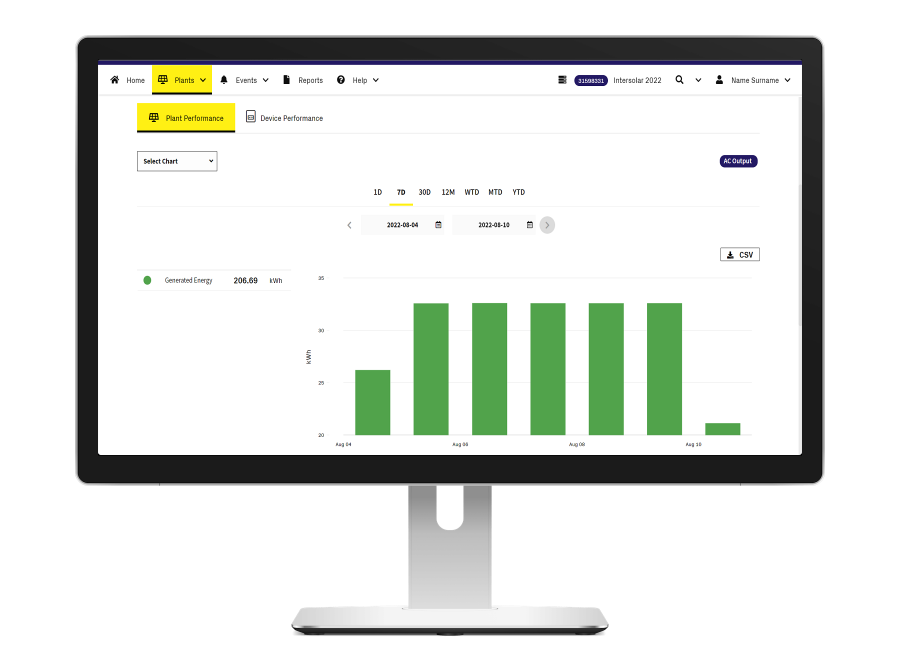
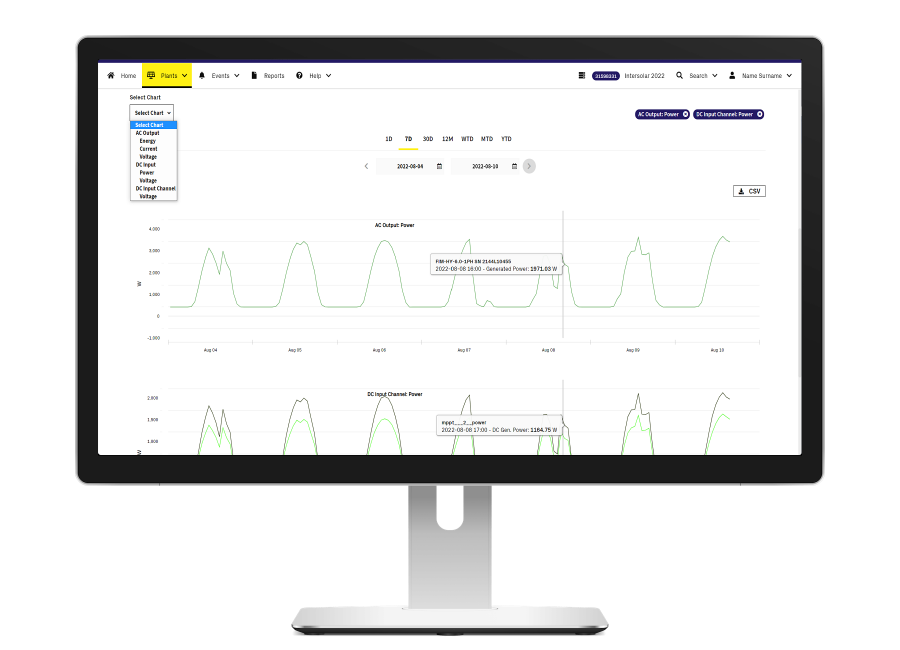
Click on the image to learn the main features available in the Plant Performance section.
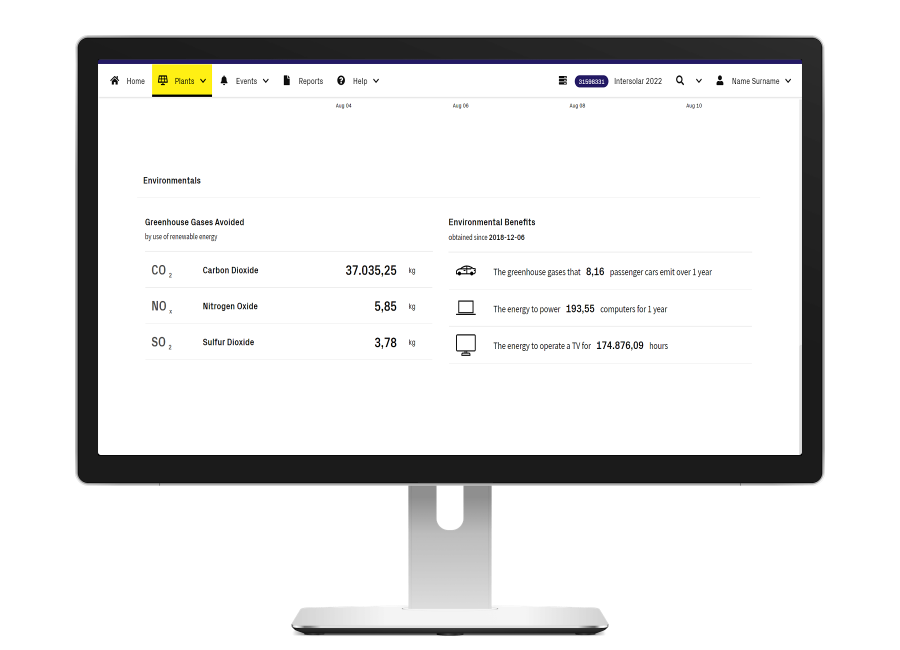
Understanding Environmental Benefits
Click on the image to learn how to understand the environmental impact that the photovoltaic system has had.
Click on the image to learn how the main features available in the Device Performance section.