List View
The List View consists of 5 columns that show, for each plant registered in your portfolio, the main relevant information and allows you to navigate and interact with the latter while discriminating at the same time their status and performance:
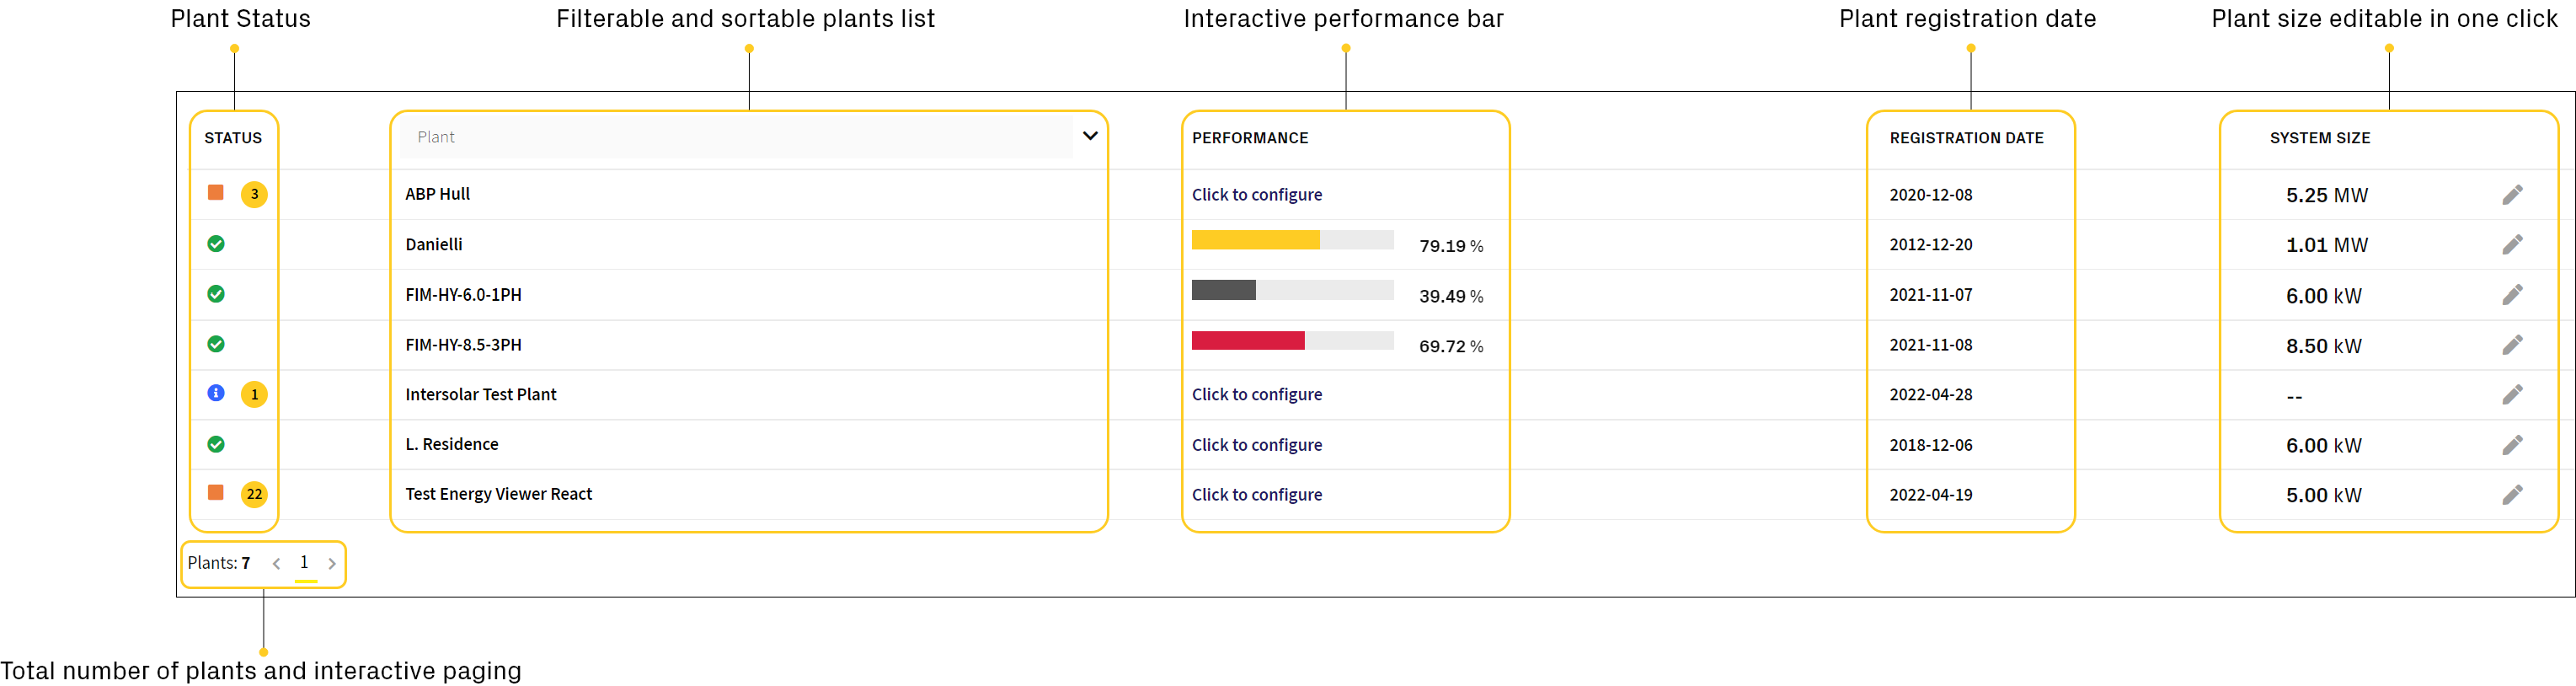
Plant Status Column
Indicates the status of the plant, according to the evaluation set in the error profile to which the considered plant is associated, representing it with different icons and colors based on the severity of the active events identified. The column shows active events only, but you can always get more detail by going to the Event Log page and filtering according to specific criteria and preferences over time. The following status color coding can be identified:
Normal Operation
No active events have been detected for the plant.
Information Severity Level
Information events have been detected for the plant.
Low Severity Level
Warning events have been detected for the plant.

Medium Severity Level
Alert events have been detected for the plant.
High Severity Level
Danger events have been detected for the plant.
When there are active error events, you will find the number of them next to the icon (regardless of their severity). Flying-over with the mouse cursor, will provide a pop-up window in which a list of these events will be rendered with their details:
Instead, by clicking with the mouse, you will be directly taken to the Event Log page with pre-set filtering on the plant and on the active events that you were actively viewing on the Home page:
Plants List Column
Provides a paged list of registered plants, where a maximum of 50 plants are displayed per page. It is possible to view the total number of registered plants in your portfolio at the bottom left, where you can also scroll through the pages and/or jump directly to a page of interest via user-input.
By default the entire list of plants is sorted alphabetically from A to Z, but it is possible to sort in reverse alphabetical order by clicking on the “angle-down” symbol placed on the header column:
The input filter is the fastest way to search for the plants of your interest, because it allows you to filter the complete list by entering letters and words:
By flying-over a plant name with the cursor, you will have a yellow highlight and, by clicking on it, you will be directly taken to the Dashboard page of that plant:
Performance Column
Shows the percentage ratio between the generated and the expected energy, in the selected time window. The percentage provided varies according to the type of algorithm set (Irradiance / Temperature or Monthly Generation) and it is possible to obtain greater detail by flying-over with the mouse on the performance bar:
If the Performance Ratio algorithm has not been configured, a quick “Click to configure” link is shown which leads to the Management page where you can set the desired algorithm for the selected plant:
Registration Date Column
Provides the registration date to Aurora Vision for each of the plants on the list and, therefore, in the portfolio. It is possible to click on the column and choosing to sort the list of plants in chronological order of registration: from the most recent to the oldest or vice versa:
System Size Column
Provides the system size for each of the plants on the list and, therefore, in the portfolio. It is possible to click on the column and choosing to sort the list of plants in direct or inverse order of size. If a plant doesn’t have a system size, there will be two bars instead of the value in kW; by clicking on the pencil icon it is possible to change the value, after which just click on the check icon to apply the change: