Home Page
The Home page is the primary landing point of Plant Portfolio Manager and allows you to have a simple and immediate view of all the information on the portfolio and on the plants registered in it.
Let’s analyze the two main parts of which it is composed.
Portfolio’s Info & Produced Energy
The summary at the top of the viewport provides portfolio-level information. Portfolio summary shows the total number of plants and the total installed capacity, while Produced Energy provides an overview of the total energy produced, at the portfolio level, for the time windows of Today, This Week, This Month and This Year (to be considered as a calendar year ).

Portfolio’s Plants View Tabs
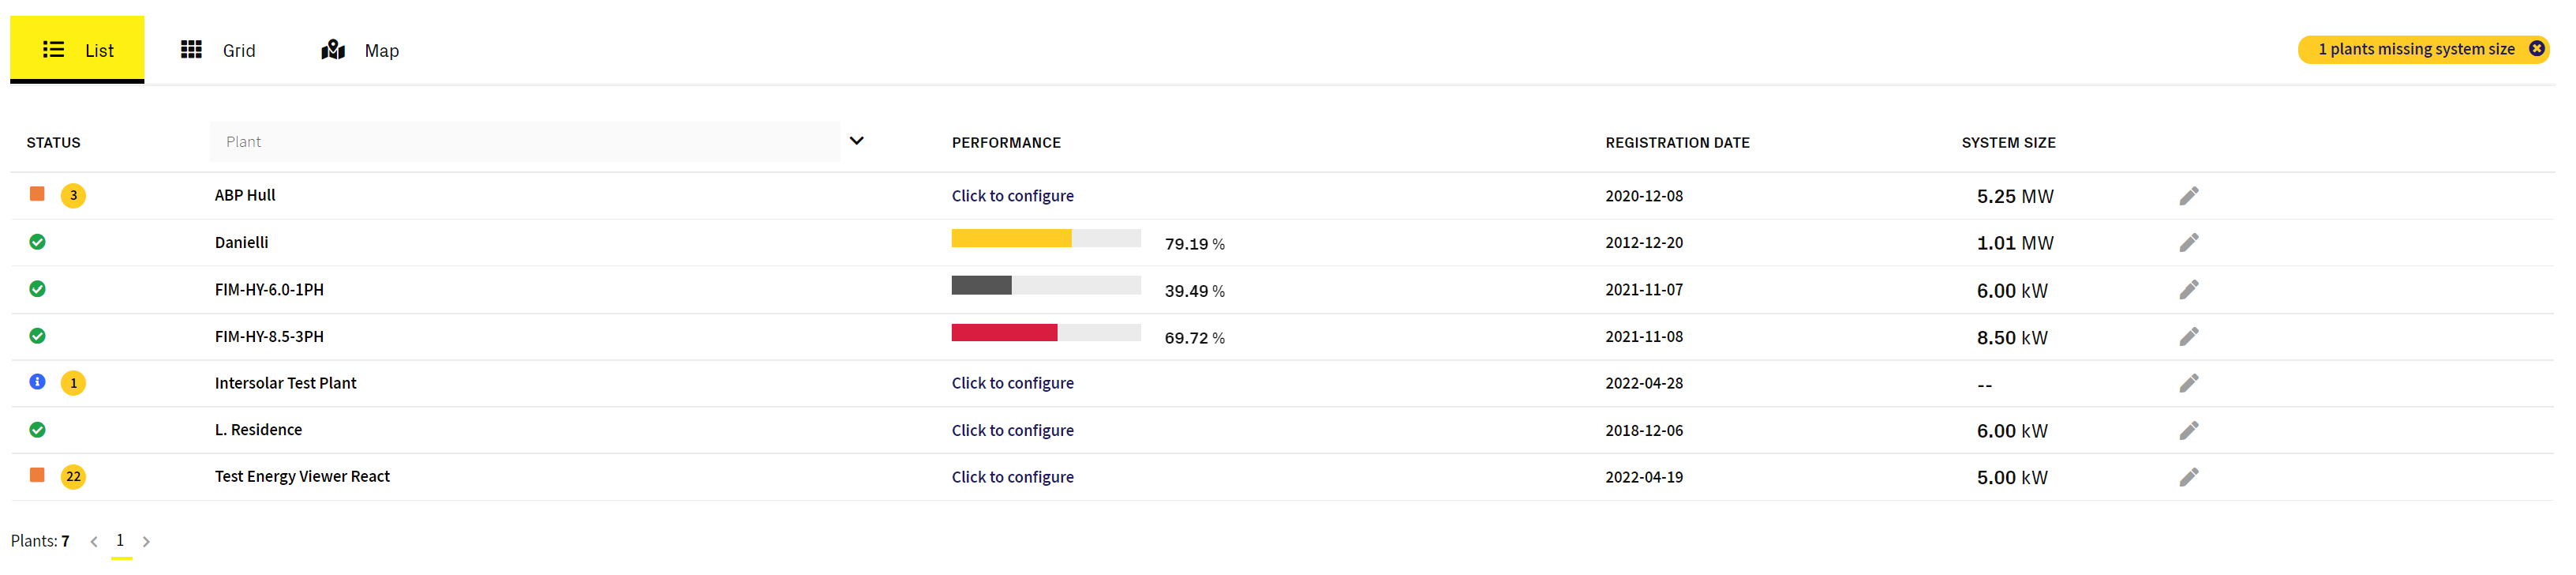
The main section of the Home page focuses on the possibility of viewing the most relevant information of the plants registered in your portfolio, by having the possibility to choose different views based on different needs. The tabs in the upper part divide the views into:
- List View: view the status and performance of your solar plants alongside dedicated information, shortcuts and filtering;
- Grid View: have an overview on the dimensional ratio of your plants, alongside their current status;
- Map View: focus on the geographical position of your plants and check their current status;
On the left, on the other hand, any information messages that may be useful to the administrator of a portfolio are mapped, such as the presence of plants that do not have an assigned System Size.
In the next sections we will analyze in detail the three views with the possibilities that each of them offers.