Grid View
The Grid View provides a visualization of the plants registered in the portfolio, with the system size correctly set, in the form of rectangles. The latter scale accordingly to the size of the plant and light up accordingly to the severity of the detected active error events:
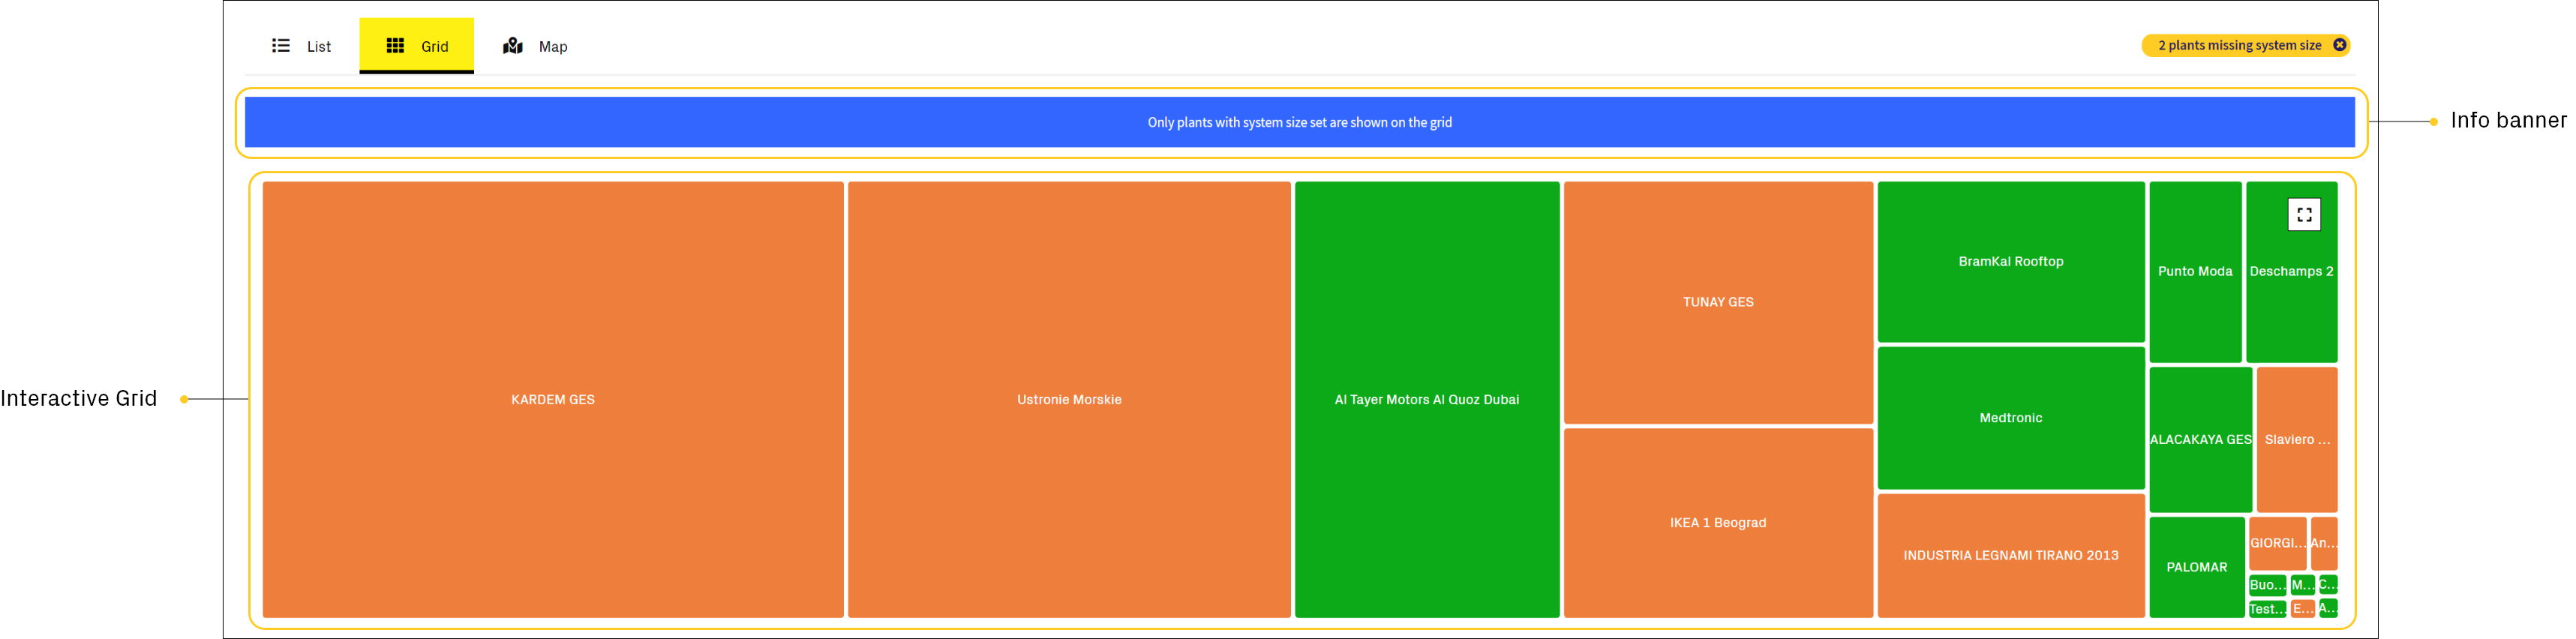
Interactive Grid
It represents the heart of the visualization.
By moving the cursor it is possible to view the details of the plants with also the list of active events; by clicking on the rectangles you can go directly to the Event Log page filtered for the specific plant whose clicked rectangle referred to:
Info Banner
Information banner that indicates to the user the need to set the System Size parameter of a plant, in order to be able to view it correctly in the Grid View.